Showing posts with label Bonds. Show all posts

Saturday, August 29, 2020

Finance 201: What is the Golden-Butterfly Portfolio?

Hi friends,

Today I shall be talking about something that is similar to the All-Weather portfolio, and one that is compared to the All-Weather by other financial writers. This portfolio has a higher exposure to stocks as compared to the All-weather. It is supposed to have a similar return as the US stock market but with lower volatility. 

This portfolio was constructed by the founder of Portfoliocharts.com, Tyler (Who is a mechanical engineer *hint* *hint*). I aim to be like him one day, even though my field of study isn't in finance, I would want to correct information to my readers for them to make the correct financial decisions in their lives.

This portfolio was an extension of the permanent portfolio, which is designed to do well in the four possible economic conditions (Prosperity - Stocks, Recession - Bonds, Inflation - Gold, Deflation - Stocks and Gold)

Golden-Butterfly Portfolio:
Stocks: 40% (20% Small-Cap IJS, 20% Total Stock Market VTI)
Bonds: 40%  (20% Long-Term Treasury Bond TLT, 20% Short-Term Treasury Bond SHY)
Commodities: 20% (20% Gold Trust GLD)

Backtest of data:
Using data from lazyportfolioetf.com
Assuming all dividends reinvested, rebalanced at the start of every year
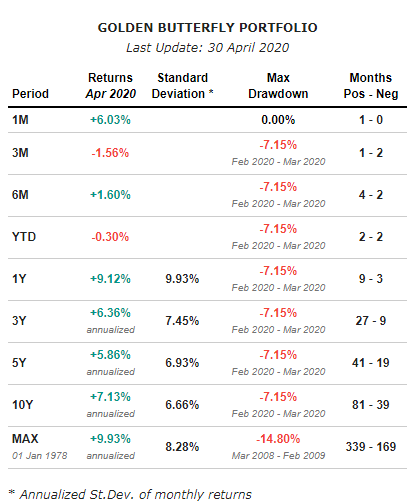


This is a really interesting return, as we can see that in 15 years rolling returns, the average annual return is 9.34%, and the worse possible case is 7.09%. I would say that I would want 20-years rolling returns ... so...

But there is a need for you to understand that it doesn't mean that you will not experience losses, there is still a standard deviation of 8.28%. It just means that over a long period, there is a lowered chance of you ending up losing money.

Thoughts and comments:

I would say that I can understand the appeal of this portfolio, as it has a higher exposure to safer assets and hence, would have a more consistent return. It would be suitable for investors who do not want to see too big a drop in their portfolio and would let their emotions take control of their investment approach.

I would say that if you can stomach the fluctuations of the market, you can consider sticking to a more risky portfolio. But yes, you should always try to understand your risk appetite.


Sources:
https://www.theoptimizingblog.com/golden-butterfly-portfolio/
https://portfoliocharts.com/2016/04/18/the-theory-behind-the-golden-butterfly/
http://www.lazyportfolioetf.com/allocation/golden-butterfly/
https://www.thesimpledollar.com/investing/retirement/why-i-chose-this-controversial-all-weather-portfolio-for-my-life-savings/
https://portfoliocharts.com/portfolio/golden-butterfly/

Wednesday, May 27, 2020

Finance 201: Different asset classes and their performance in different economic climates


Hi friends,

Welcome to the first part of my Finance 201 series. In the articles that are labeled under this series, I will assume that you already have a basic understanding of different financial instruments (bonds, stocks, ETFs, hedge funds). If not, do take a look at my Finance 101 series.


As the first part of this "higher level" series, I plan to at a closer look at the different portfolios of famous investors and I will be talking about their respective investment approach and their backtested investment returns. To do that, I felt that it is important for us to understand the performance of different asset classes in different economic climates (like recession, bull, or bear market). 


To do that, I will be looking at the correlation coefficient of their returns. For those that don't know what is a correlation coefficient, it is a statistical measure of the strength of the relationship between the relative movements of two variables.  Essentially, if I increase by 10%, you increase by 5%, and if I increase by 5%, you increase by 2.5% and if I decrease by 10%, you decrease by 5%, we would be positively correlated. When I change by a certain percentage, you would also change by a certain percentage. A negative correlation would just mean that if I increase, you decrease, if I decrease, you increase. This correlation coefficient is also a measure of a linear relationship.


The values of the correlation coefficient are from -1 to 1. -1/+1 would mean a negative/ positive perfect correlation. While 0 would indicate no correlation. 


First off, we will be taking a look at the long-term correlations between the assets (1960 to 2017), then we will take a look at the correlations in different specific economic climates. For the bull market climate, we shall look at 2010 to 2019. For the bear market climate, we shall look at 2007 to 2009 (Great Financial Crisis anyone?). I was hoping to find more data for the other recessions like the dotcom bubble and all that, but I can't seem to find it. Do let me know if you have access to any studies on it. 


Long-term correlation (1960-2017):


Across the board, with no distinction between upmarket and downmarket: 

Looking at the highlighted portion for Table 3 Part A,
Real Estates (Global Real Estates, Commercial, Residential, etc) has quite a strong positive correlation (0.73) with equities (stocks). 
Non-government bonds (think commercial bonds) has a mild positive correlation (0.52) with stocks Government bonds have a weak positive correlation (0.27) with stocks 
Commodities (Rare metals like Gold, Silver, Platinum) have no correlation (-0.04) with stocks

Looking at the downmarket (Where the price of the asset ends the year lower than the start of the year) highlighted in red, table 3 part B:

Real Estates have a strong positive correlation (0.76) with stocks
Non-government bonds have a weak positive correlation (-0.36) with stocks 
Government bonds have a weak negative correlation (-0.15) with stocks
Commodities have a mild negative correlation (-0.46) with stocks 

Hence, we can see that "safe haven" assets like bonds and commodities do exhibit different behavior in a downmarket compared to the average performance. They move into more negative correlations with stocks

Looking at the upmarket (Where the price of the asset ends the year higher than the start of the year) highlighted in blue, table 3 part B:

Real estates have a mild positive correlation (0.58) with stocks
Non-government bonds have a mild positive correlation (0.48) with stocks
Government bonds have a weak positive correlation (0.31) with stocks
Commodities have no correlation (-0.07) with stocks 

Hence, we can see that in an upmarket, the assets are more in line with long-term behaviors in table 3 part A. Except for Real estates, which moved towards a more negative correlation with stocks. 

Summary for this part (+ means more positive correlation with stocks, - means more negative correlations with stocks and 0 means almost no change):

                                   |Upmarket | Downmarket|
Real estates                 |       -       |         0         |
Nongovernment bonds  |      0        |         -         |
Government bonds       |      0        |         -         |
Commodity                  |      0        |         -         |

#ADMIRE MY GHETTO TABLE#

These are the long-term performance of these assets. 


Here we can see that the 20-years overlapping average correlation between the different asset classes with stocks and bonds.

We will now look at the bull-market correlations from 2010-2019:


We can make the following observations:
Investment-grade bonds have a weak negative correlation (-0.22) with US stocks
Commodities have a mild positive correlation (0.57) with US stocks
Global (All stocks in the world) stocks have a strong positive correlation (0.97) with US stocks
International (All stocks in the world except the US) stocks have a strong positive correlation (0.87) with US stocks
REITs have a mild positive correlation (0.65) with US stocks

Here we can see that this is in contrast with our previous data. This is where I will need to clarify that the 2010 - 2019 is actually an anomaly, as it was the longest bull-market that we have ever seen. So you will need to take note of this observation. Furthermore, an upmarket year in the first part means that a rise of 0.1% would still constitute as an upmarket. While 2010-2019 was upmarket on steroids, with consecutive upmarkets. Hence, I felt a need to look specifically at a bull-market period rather than an upmarket year

Let us take a look at the performance in turbulent times (2007-2009) during the Great Financial Crisis (This is different from the down market, as it represents a significant downmarket. This is in contrast to part one where a 0.1% drop in market price between the start and the end of the year would mean a downmarket)


We can make the following observations: 
International stocks have a strong positive correlation with US stocks
Emerging market stocks have a strong positive correlation with US stocks
REITs have a strong positive correlation with US stocks
Commodities have a mild positive correlation with US stocks
High yield bonds have a strong positive correlation with US stocks
International bonds have a mild positive correlation with US stocks

Hence, we can see this dragging effect of stocks for the majority of the financial instruments especially in times of volatility, with all of them having a positive correlation with stocks. 

I honestly did not expect this behavior. However, there is a limitation as there are no correlations between stocks and US bonds... 

With that, I hope that you can have a good understanding of the different correlations of different assets in different economic conditions. It was certainly beneficial to me. hahaha

With that, 
I end today's topic. 

Stay vested, Stay frugal my friends,

Dionysius

Sources:
https://www.guggenheiminvestments.com/mutual-funds/resources/interactive-tools/asset-class-correlation-map
https://www.vanguard.co.uk/documents/adv/literature/dynamic-correlations.pdf
https://academic.oup.com/raps/advance-article/doi/10.1093/rapstu/raz010/5640504

Saturday, May 23, 2020

Finance 101: What is a portfolio?

Hi friends, 

I bet that you have heard of it before. "I have a portfolio of blah blah blah", or "How big is your portfolio?" So... What is this "portfolio" that everyone who is investing/ planning their finances is talking about? Today I shall be tackling this question:

Definition:
A portfolio is a grouping of financial assets such as stocks, bonds, commodities, currencies and cash equivalents, as well as their fund counterparts, including mutual, exchange-traded and closed funds. A portfolio can also consist of non-publicly tradable securities, like real estate, art, and private investments. - Investopedia

A portfolio refers to a collection of investments or financial assets held by an individual, investment company, financial institution or hedge fund. This grouping of financial assets can include everything from gold and property to stocks, bonds, and cash equivalents. In essence, an investment portfolio acts as a big briefcase-carrying all of these financial assets. - Capital

These are the essential points.

1. Group of financial assets (Financial instruments that can be anything that we discussed and more, like real estates, arts, whiskey, etc)

2. Held by an individual, company, funds. 


For today, we will be talking about your individual portfolio. As per the definition, your portfolio is a combination of the different financial instruments that you are holding. A portfolio is also something that you should build based on your preferences. It should be in line with your investment beliefs and your risk appetite

Here are some of the things you should consider before setting off to build your portfolio:

1. What is your risk tolerance? 
How much gain/loss are you able to tolerate? Are you ok with a portfolio that can give you large returns and losses?

2. What is your time horizon?
A longer time horizon would mean that you can create a portfolio that has a higher potential for appreciations. 

3. What assets are you comfortable/ familiar with?
If you are competent and have a lot of experience with a particular financial instrument, you can consider having more of your portfolio allocation to the instrument that you are familiar with. 

Here are some of the financial instruments that you can have in your portfolio. We have actually gone through the majority of them in the other Finance 101 articles:

1. Stocks, etfs, mutual funds, index funds, Reits 
2. Bonds, bond funds
3. Gold, precious metals
4. Crypto (Bitcoin, ethereum)
5. Real estates 
6. Other financial instruments like alcohol, art, etc
7. Commodities like copper, steel, oil
8. Insurance

As we are talking about the personal portfolio, in which I would assume that you do not have the need to invest in commodities, alcohol, art etc. We will focus on 1,2,3,4,5,8 I will analyse it from the POV of a) Aggressive investors (with a long time horizon) b) Conservative investor (with a shorter time horizon) c) Investor who is looking to pass intergenerational wealth d) ultra-aggressive investor

Do note that the allocations are just for example. You should do your own research. 

a) Aggressive Investor (For those who wants :
1. Stocks (85% in etf, individual stocks)
2. Bonds (0%)
3. Precious metals (4% in gold)
4. Crypto (1%, treat it as a gamble)
5. Real Estates (5%)
8. Insurance (5%, to protect against sudden events)

b) Conservative Investor (For those who wants to have some returns but cannot take too many losses)
1. Stocks (20% in etfs, and reits etfs)
2. bonds (60% in bond funds)
3. Precious metals (5% in gold)
4. Crypto (0%)
5. Real Estates (5%)
8. Insurance (10%)

c) Generational Wealth Investors (For those who wishes to pass to their offsprings without incurring taxes)

We do not have inheritance tax in Singapore. But do know that if you pass on properties, your offsprings might need to pay property taxes on it, or pay for the maintenance fees. 

Hence, you might want to consider holding on to stocks and bonds. 

d) Ultra-aggressive Investors (me, with about 30-40 years of investing)
1. Stocks (95% in etf, individual stocks/ reits)
2. Bonds (0%)
3. Precious metals (0%)
4. Crypto (0%)
5. Real Estates 
(0%)
8. Insurance (5%, to protect against sudden events)

I will reiterate this again. Your portfolio would be reflective of your investment beliefs. Your portfolio should be tailored to your needs. Of course, with a portfolio, you should always look at it every now and then to rebalance it. The rebalancing would allow your portfolio realigned with your chosen allocations. This rebalancing should be around once per 3 months. 

As always, do take note that the allocations are just examples, you should always do your own research before making any financial decisions. 

Also, now that we have settled a majority of the financial instruments, I will be moving on to the most famous financial portfolios that are held by famous investors like Warren Buffett, Ray Dalios, etc. It will be named "Finance 201". I am an Engineer for goodness sake. How creative do you think I am :')  Don't worry. Finance 101 series will still run on, just keep sending in request so that I know to explain some of the basic terms that I have used in my posts

With that, 
I end today's topic

Stay vested, Stay frugal my friends,
Dionysius


Wednesday, May 20, 2020

Finance 101: What is a Bond?

Hi friends, 

Bond, James Bond


Up to this point, I hope that you have benefitted from this series. 
I have also benefitted from the series as I learned about infographics design for this series and reinforced my financial knowledge as well. Do let me know if you have any ideas for Finance 101 or any other series that I can do. 

With that out of the way, let's look at the financial instrument that allows you to be a loan shark - Bonds. So, what is a bond? 


Definition:

A bond is a fixed income instrument that represents a loan made by an investor to a borrower (typically corporate or governmental). A bond could be thought of as an I.O.U. between the lender and borrower that includes the details of the loan and its payments. - Investopedia

Bonds are debt instruments. When you buy a bond, you are lending money to the company or government institution issuing the bond for a fixed rate of return. -DBS


The keywords are:

1. Loan/debt
2. From company/government to investor
3. Fixed-rate of return

Essentially, you are lending a sum of money to a company or government, in which you will receive interests annually for the period and you will receive the sum of money that you lent at the end of the period. The entity that issued the bonds would use the money and invest in projects/infrastructures that they believe will have a better return compared to the interest they pay you. (i.e, I borrow $5,000 at 1% interest, to invest for a return of 8%. Profit for me 7%)


Furthermore, in the event where the entity is unable to pay its debt (default), bondholders have higher priority over stockholders over the liquidated asset of that company. When the company makes money, bondholders are also prioritised over stockholders in receiving the money. 


"That's great! Why does everyone not rush to bonds?" Good question, that's because historically, bonds have an average return of 5% but stocks have an average return of 10%. Furthermore, low risk doesn't mean no risk. There are cases where companies or countries that have defaulted on their loans (Does the name Hyflux ring a bell?).


Hence, bonds as a financial instrument would be suited for a conservative investment approach. This is the reason why we are recommended to allocate more of our portfolio to bonds as we age. Furthermore, bonds are income-generating assets rather than growth assets. Hence, if your desire is to have passive income, you may look at bonds as a valid option. 


BUT, if you would refer to my 4% Rule article, you would know that bonds are unable to last you that long into retirement based on historical data. Furthermore, Warran Buffett has not incorporated bonds into his portfolio at his age as well. So you might want to take that into consideration. 


After this long period of voicing my opinion, let's look at the advantages and disadvantages of owning bonds. 


Advantages: 

1. Safe and consistent income - due to the interest rate (coupon) that you will receive
2. Higher on the priority list in the event of liquidation
3. Passive income 
4. Diversify your portfolio as it is a different financial product from stocks

Disadvantages:

1. Lower returns as well
2. Default is still probable
3. Some bonds are not available to retail investors (Some bonds are too high in value, $250,000 for one bond)

These are the priority of bonds payout (A higher priority would mean that you would be paid first in the event of liquidation) 

1. Senior secured bonds (secured means that that debt is backed with collateral)
2. Senior unsecured bonds 
3. Junior Subordinated bonds
4. Guaranteed and insured bonds (The guaranty is from a third-party, but not 100% insured.)
5. Convertible bonds (Can be converted to common stock)

How to find the right bond?
1. Coupon Rate: It is the interest rate paid on the bond (3% of $1000 would be $30)
2. The seniority of the bond: If you have higher priority if the company is liquidated
3. Outlook of the company: If the company is over-leveraged on debt, income statement etc. 
4. Inflation trend: If inflation is at 3% and your bond has an interest rate of 3%, your effective return is 0
5. Liquidity of the bond: If you require money in a short amount of time, are you able to redeem the bond for cash? You can look at the daily trading volume of that bond. 

Thoughts and comments:
As bonds are currently not in my portfolio, I am not that familiar. However, if you wish to diversify your risk, you might want to consider using bond ETFs which has a lower chance of losing your money. 


Sources:

https://www.investopedia.com/terms/b/bond.asp
https://www.dbs.com.sg/personal/investments/fixed-income/understanding-bonds
https://www.investopedia.com/articles/investing/121815/understand-security-types-corporate-bonds.asp
https://www.investopedia.com/articles/bonds/09/bear-on-bonds.asp
https://www.investopedia.com/articles/bonds/07/fixedincome.asp